About Our Map
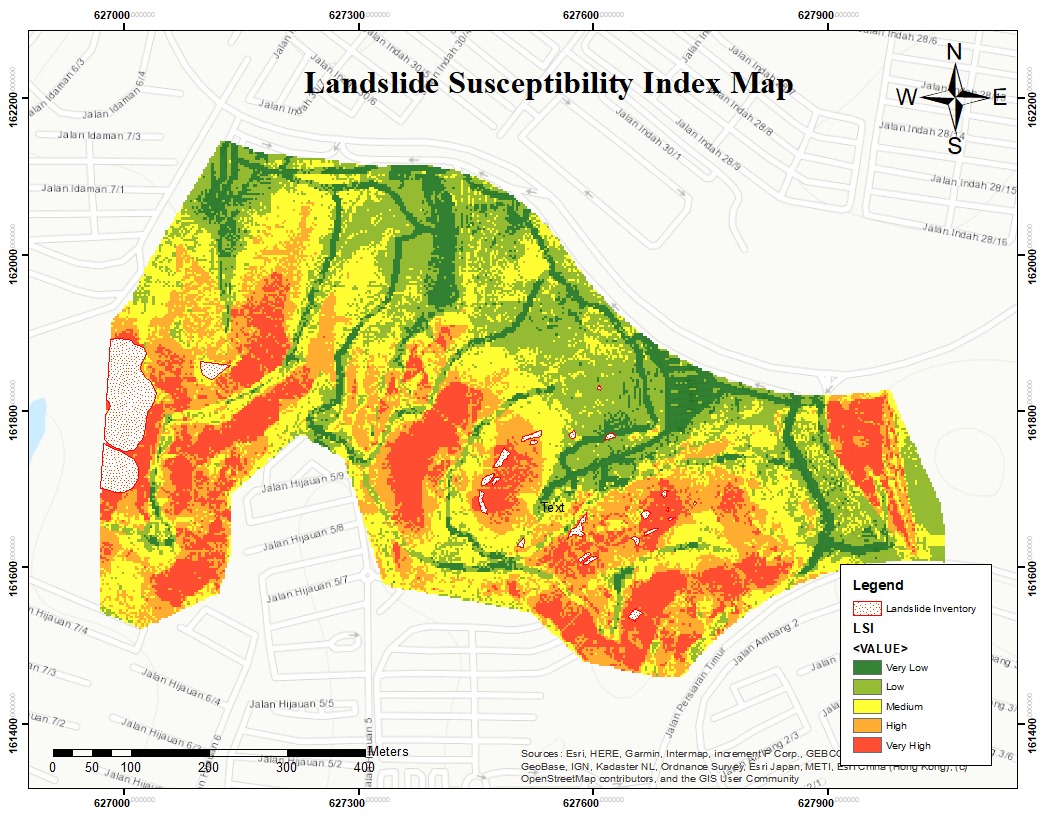
The landslide susceptibility map serves as a vital tool for delineating zones according to their vulnerability to landslides. Zones of very high susceptibility are represented by a dark red hue, indicating a significant likelihood of landslide occurrence. Adjacent in risk are areas shaded in orange, denoting high susceptibility. Transitional zones with moderate landslide potential are depicted in yellow, serving as a cautionary signal for potential but less frequent events. Areas with a lower probability of experiencing landslides are marked in light green, suggesting a relatively mild level of risk. In contrast, regions with the lowest assessed risk are colored in dark green, portraying these areas as unlikely to be affected by landslides under normal circumstances. The area with dot pattern on the map are landslide inventories. Most of the landslide inventories can be seen at the red areas.